1
Derivatives Rollover Report
| December 31, 20
21
For Private Circulation Only
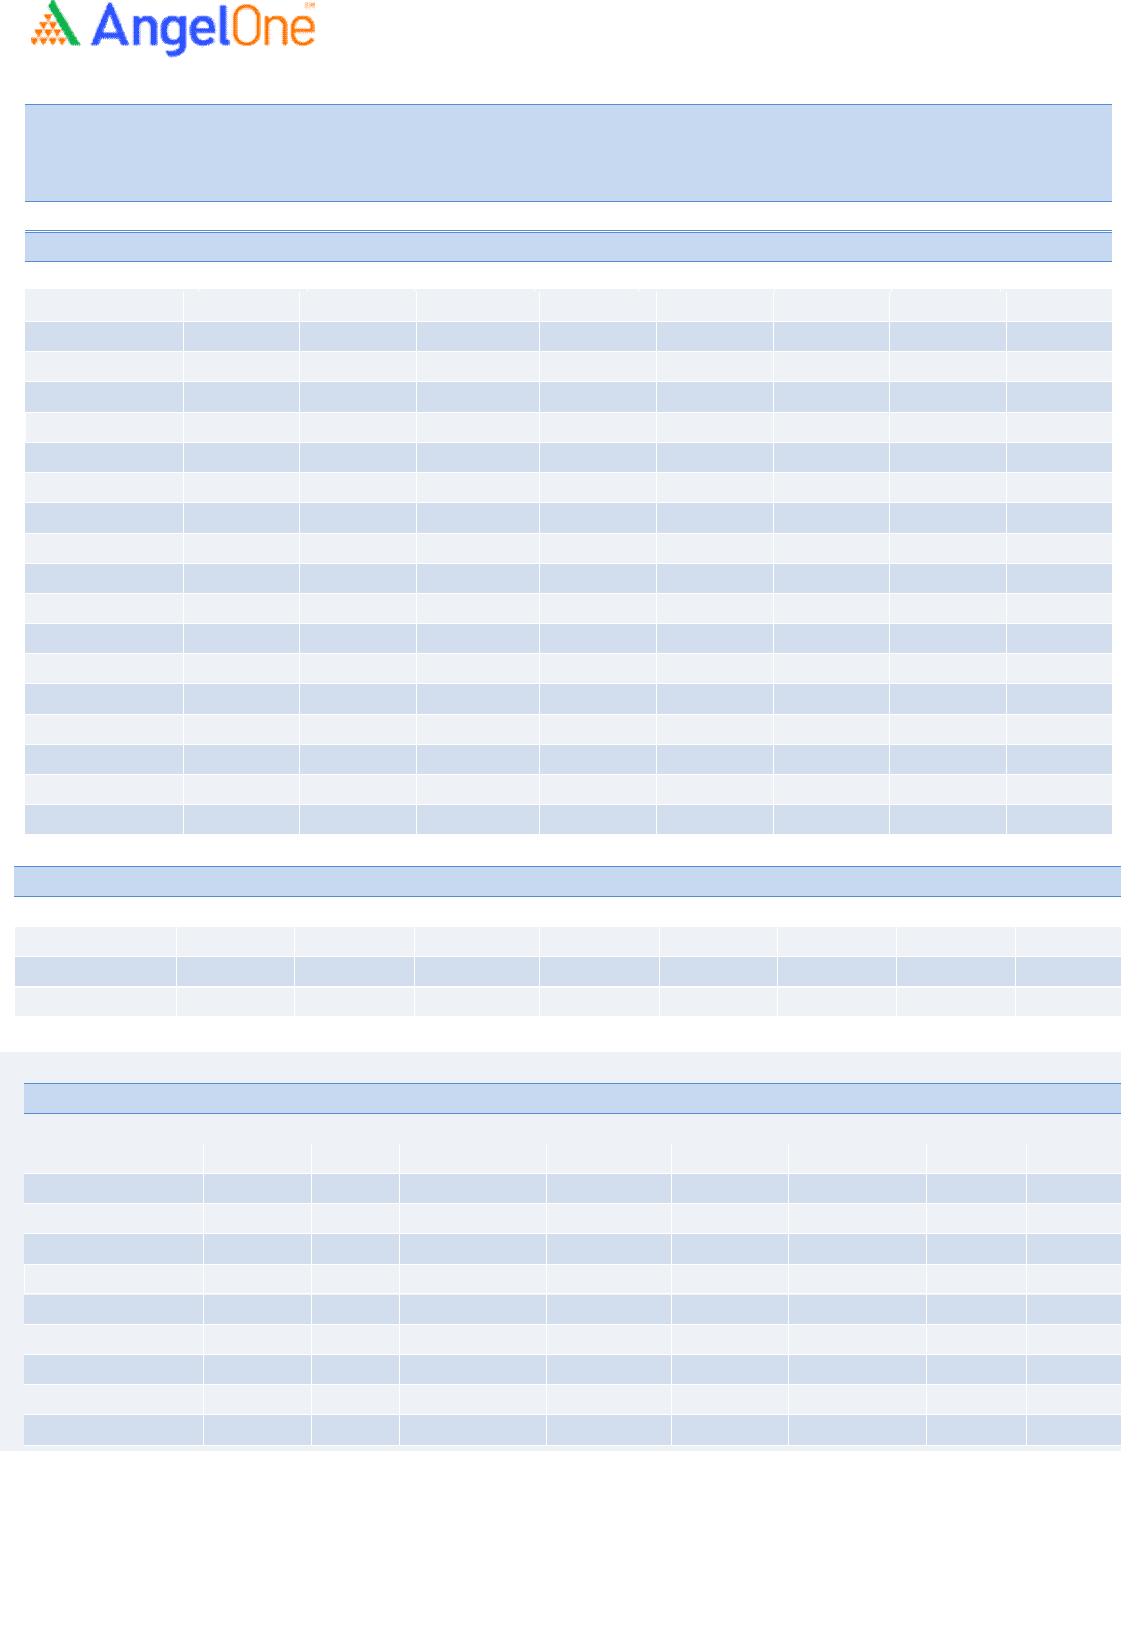
NIFTY & PCR Graph
Monthly Gainers
Scrip Price
Price
Change
(%)
Open
Interest
Ol
Change
(%)
IDEA 14.15
19.92
502250000
(43.15)
GMRINFRA 46.90
18.58
132660000
15.02
PERSISTENT 4841.55
18.46
397950
56.61
METROPOLIS 3441.35
17.08
534200
(14.50)
NAVINFLUOR 4178.00
16.44
350325
(33.46)
Note: Stocks which have more than 1000 contract in Futures OI.
Monthly Losers
Scrip Price
Price
Change
(%)
Open
Interest
Ol
Change
(%)
IEX 248.60
(68.15)
37331250
199.01
RBLBANK 130.85
(35.13)
29243600
8.98
SRTRANSFIN 1203.25
(23.61)
3267200
20.85
BANDHANBNK 248.25
(21.61)
23245200
15.92
WHIRLPOOL 1773.00
(20.22)
902750
160.35
Note: Stocks which have more than 1000 contract in Futures OI.
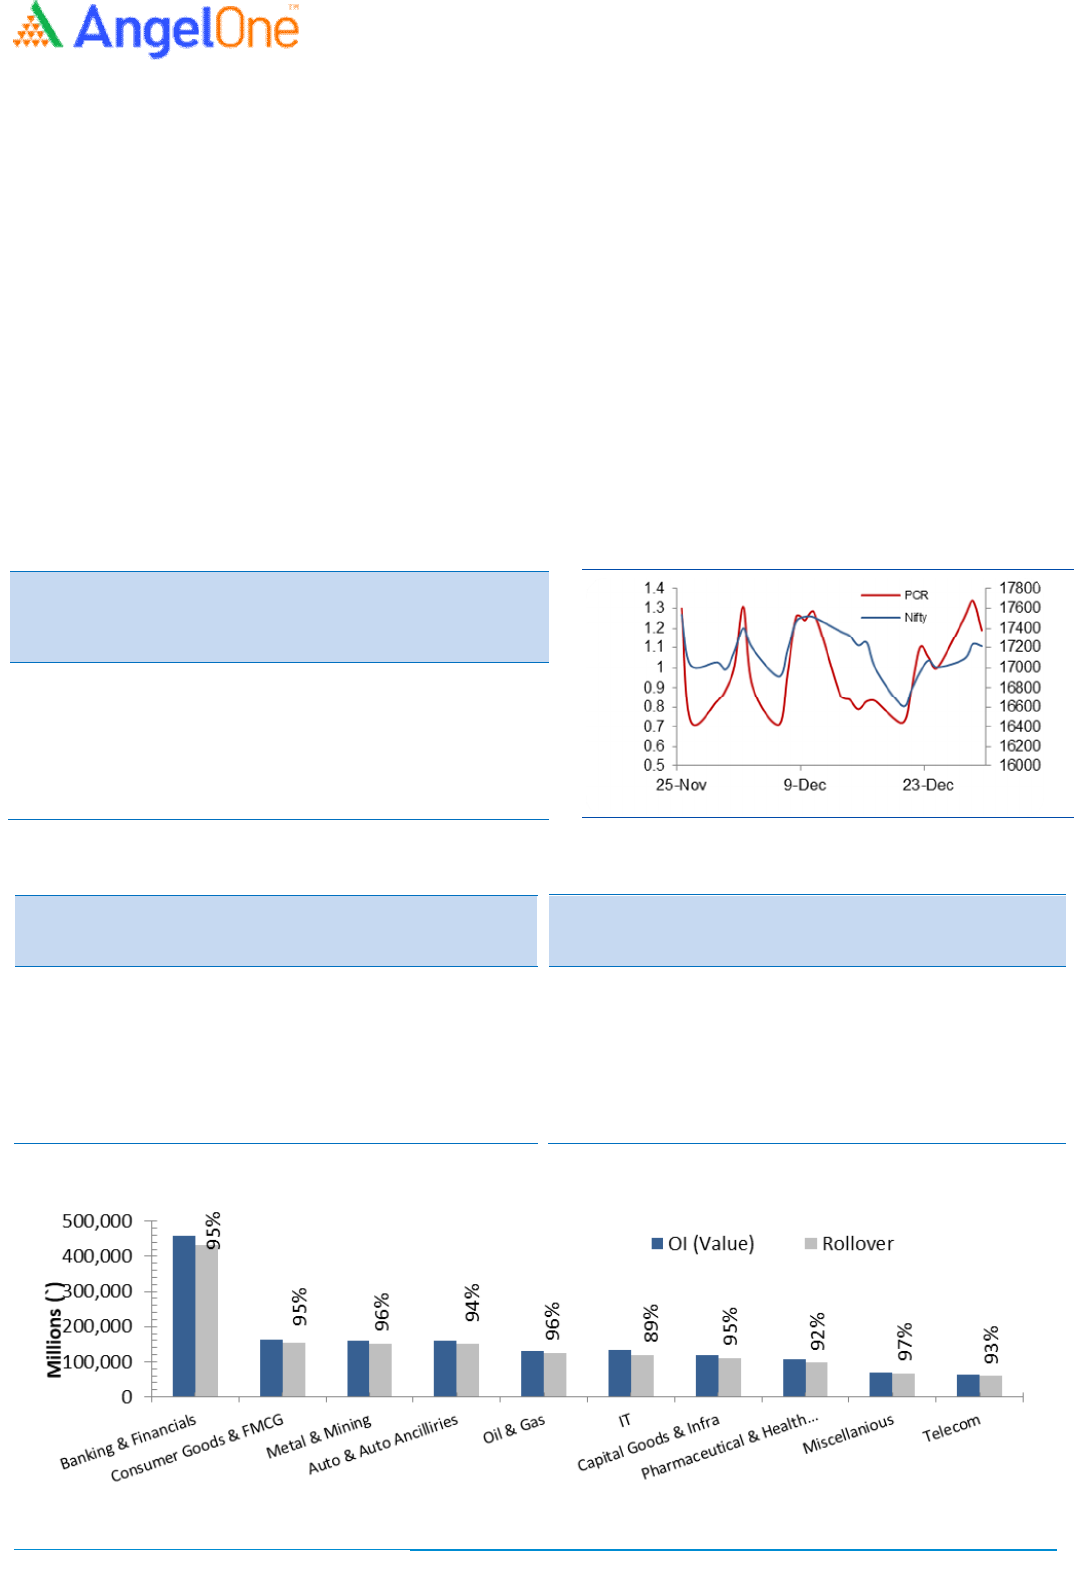
The concluding series of the calendar year was very similar to the roller coaster ride for market participants. On the first
day
itself, we saw index breaching the strong support zone of 17200 on a closing basis. As we progressed, the selling
aggrandized across the board to test 16800. But soon after, index managed to recover well to reclaim 17600. This wasn’t
done yet, as bears were back with brutal force this time to drag index towards the 16400 mark. Fortunately there was no
further damage to it as we witnessed a smart recovery towards the fag end to reclaim 17200 with some authority.
As far as F&O activity is concerned, although we experienced
wide swings in the benchmark index; there was an open
interest reduction series on series. The banking index underperformed throughout the series but hardly added any relevant
bets during the month. Rollover for Nifty stood at 83%; which is below the three
month average. Stronger hands continue
selling equities in the month of December, they sold to the tune of Rs. 36,069 crores till date. Meanwhile, they also
preferred unwinding longs and added few shorts in index futures segment, resulting their ‘Long Sho
rt Ratio’ declining from
70% to 66%. Considering the sell-
off with no major shorts, we expect some respite going ahead. Hence, traders are advised
to trade with a positive bias till the time index stays above 17100-17200; whereas, on the higher side, 17500-
17600 should
act as a sturdy wall.
Indices Change
INDEX Price
Price
Change
(%) Rollover
3 month
avg.
NIFTY 17203.95 (1.83) 78.91 81.26
BANKNIFTY 35063.60 (6.16) 84.79 82.97
- - - - -
- - - - -
- - - - -
Derivatives Rollover Report
For Private Circulation Only
2
Scrip Price
Price
Change
(%) OI Futures
OI
Change
(%) COC (%) PCR-OI
Rollover
(%)
Average
Rollover
(3month)
(%)
AUTO & AUTO ANCILLARIES
AMARAJABAT 621.10
(1.00)
9191000
(10.56) 4.85
0.65
95.98
87.39
APOLLOTYRE 217.50
(2.38)
9792500
(8.14) 2.10
0.77
95.12
94.25
ASHOKLEY 121.00
(10.04)
36297000
(19.46) 4.32
0.82
93.07
91.91
BAJAJ-AUTO 3211.45
(5.64)
3286500
5.12 4.34
0.62
96.31
94.96
BALKRISIND 2275.40
1.04
1426400
9.04 7.08
0.35
96.61
85.10
BHARATFORG 694.80
(5.67)
7631250
(22.85) 1.69
0.93
98.02
95.95
BOSCHLTD 16773.95
(0.71)
151050
11.89 -7.61
0.37
96.73
94.05
EICHERMOT 2563.00
1.27
3305750
(10.59) 3.06
0.41
98.16
93.40
ESCORTS 1911.00
4.62
5126000
10.85 1.47
0.62
85.95
86.95
EXIDEIND 165.90
(2.73)
23169600
(15.04) 5.92
0.51
91.51
94.51
HEROMOTOCO 2437.40
(6.31)
4413000
(3.06) 2.95
0.84
95.43
94.43
M&M 833.00
(6.97)
10705800
4.56 5.82
0.45
88.32
87.95
MARUTI 7302.65
(4.02)
2252900
(17.15) 3.64
0.48
95.19
95.70
MOTHERSUMI 215.70
(7.15)
27240500
(3.17) 3.64
1.27
97.02
95.96
MRF 72223.45
(5.01)
58840
(7.29) 1.86
0.47
98.13
97.49
TATAMOTORS 472.80
(4.40)
77956050
(12.35) 6.65
0.84
92.93
94.70
TVSMOTOR 615.25
(12.80)
7543200
33.73 -0.95
0.52
92.58
93.54
BANKING & FINANCIALS
AUBANK 1037.30
(13.15)
3708000
2.84 -7.50
0.86
96.93
97.58
AXISBANK 672.45
(1.57)
52338000
(14.22) 7.02
0.85
96.82
95.65
BAJAJFINSV 16222.55
(6.79)
584300
(5.86) 4.43
0.55
93.65
89.11
BAJFINANCE 6903.05
(3.45)
3807000
(7.48) 6.07
0.78
97.03
96.40
BANDHANBNK 248.25
(21.61)
23245200
15.92 -2.88
0.84
93.92
95.77
BANKBARODA 80.50
(13.90)
135369000
(1.36) 5.69
0.71
94.48
93.12
CANBK 195.80
(9.46)
53659800
8.89 5.35
0.78
97.15
95.14
CHOLAFIN 511.60
(12.90)
7876250
(3.06) 7.43
0.37
97.63
94.83
CUB 136.55
(10.81)
9373800
6.68 5.75
0.72
95.51
95.81
FEDERALBNK 82.30
(11.55)
93100000
(7.91) 1.59
0.51
94.08
94.71
HDFC 2575.00
(10.51)
13231500
5.08 5.75
0.50
97.15
96.17
HDFCAMC 2411.60
(4.96)
3153000
(4.09) 1.65
0.91
97.37
95.86
HDFCBANK 1466.60
(4.22)
34136300
(8.73) 4.55
0.81
96.18
95.83
IBULHSGFIN 214.90
(5.85)
19914400
(45.46) 12.55
0.53
66.54
78.39
ICICIBANK 739.50
(1.74)
79987875
(17.35) 6.73
0.63
91.57
92.83
ICICIPRULI 553.00
(8.31)
5525250
37.19 1.89
0.63
95.32
96.14
IDFCFIRSTB 47.60
(2.36)
153479700
(4.90) 2.74
0.64
96.73
95.96
INDUSINDBK 886.45
(8.09)
26612100
12.48 1.55
0.83
95.62
95.53
KOTAKBANK 1763.90
(13.33)
16344000
28.28 6.42
0.63
94.68
94.15
Derivatives Rollover Report
For Private Circulation Only
3
Scrip Price
Price
Change
(%) OI Futures
OI
Change
(%) COC (%) PCR-OI
Rollover
(%)
Average
Rollover
(3month)
(%)
L&TFH 76.60 (3.47) 63253312 (9.30) 5.98 0.87 96.62
96.18
LICHSGFIN 363.45 (8.47) 12836000 (2.28) 5.76 0.90 93.64
93.22
M&MFIN 147.25 (12.64) 27816000 8.67 0.00 0.92 92.61
94.71
MANAPPURAM 163.00 (6.62) 17577000 (18.63) 3.61 0.78 94.44
93.17
MFSL 972.10 1.43
1244100 (29.14) -13.34 0.27 97.65
93.99
MUTHOOTFIN 1485.90 (0.14) 3146625 (15.49) 5.64 0.87 98.61
97.14
NAM-INDIA 347.15 (11.04) 3528000 36.79 3.77 0.64 95.54
94.78
PFC 118.50 (4.59) 40765000 (12.29) 5.52 0.78 93.09
89.76
PNB 37.20 (7.46) 264656000 (3.64) 1.75 0.77 96.30
93.68
RBLBANK 130.85 (35.13) 29243600 8.98 1.50 0.47 85.18
#N/A
RECLTD 131.35 (2.01) 36942000 (28.00) 2.98 0.80 93.97
#N/A
SBIN 454.10 (7.86) 100585500 (7.41) 6.93 0.60 95.33
94.67
SRTRANSFIN 1203.25 (23.61) 3267200 20.85 5.60 0.57 91.71
91.20
CAPITAL GOODS & INFRASTRUCTURE
ADANIPORTS 725.90 (5.23) 87338750 (2.24) 2.97 0.70 98.97
97.97
BHEL 57.35 (9.04) 113631000 10.26 5.71 0.67 96.79
96.45
GMRINFRA 46.90 18.58
132660000 15.02 6.99 0.64 96.72
96.36
HAVELLS 1391.95 (0.03) 3185000 13.14 4.56 0.51 89.54
90.97
LT 1895.80 1.96
11445375 5.15 6.98 0.38 85.35
91.15
SIEMENS 2361.40 9.62
1715725 (5.54) 3.71 0.21 86.47
#N/A
VOLTAS 1201.00 (0.32) 2388500 47.80 2.39 0.38 96.45
92.43
CEMENT
ACC 2167.55 (9.61) 2439000 21.60 2.62 0.49 94.89
95.57
AMBUJACEM 372.80 (4.93) 12523500 (1.24) 6.50 0.49 95.28
95.48
GRASIM 1601.65 (9.64) 12147175 14.10 6.42 0.67 98.40
98.34
RAMCOCEM 986.50 (0.53) 1639650 (29.73) 2.05 0.44 98.87
97.67
SHREECEM 26547.55 (0.67) 153275 (10.38) 6.61 0.48 99.08
98.20
CHEMICALS & FERTILIZERS
COROMANDEL 753.85 (0.59) 1048750 (30.05) 2.43 0.48 97.28 95.29
DEEPAKNTR 2451.85 13.00
2189500 (20.45) 6.12 0.45 96.81 95.27
NAVINFLUOR 4178.00 16.44
350325 (33.46) 5.78 0.16 60.35 71.91
PIDILITIND 2446.80 8.10
2007000 (22.31) 6.91 0.34 95.07 94.78
PIIND 3000.25 (0.26) 1583500 (5.88) 4.45 0.16 98.91 97.96
TATACHEM 887.05 (1.88) 6863000 (13.92) 4.57 0.61 96.43 94.72
UPL 750.85 2.72
24502400 (3.32) 7.33 0.69 95.42 96.31
Derivatives Rollover Report
For Private Circulation Only
4
Scrip Price
Price
Change
(%) OI Futures
OI Change
(%) COC (%) PCR-OI
Rollover
(%)
Average
Rollover
(3month)
(%)
Consumer Goods & FMCG
ASIANPAINT 3381.25 7.11
3433800
(9.06) 6.02 0.49
94.62 93.40
BERGEPAINT 762.65 0.13
4712400
23.96 5.32 0.55
97.67 95.60
BRITANNIA 3586.90 (0.14) 1260200
(8.40) 4.72 0.85
94.51 94.86
COLPAL 1464.85 0.05
3074750
(13.82) 2.81 0.58
97.85 96.41
DABUR 572.45 (5.90) 10168750
9.18 2.05 0.61
96.90 95.63
GODREJCP 954.35 3.46
5283000
12.87 5.56 0.54
96.37 95.56
HINDUNILVR 2335.10 (1.06) 9695400
(5.08) 5.33 0.78
96.17 95.59
ITC 217.05 (6.63) 226716800
(3.46) 6.34 0.66
95.04 95.75
JUBLFOOD 3534.15 (6.46) 1672125
15.69 4.74 0.55
96.33 94.88
MARICO 508.45 (7.49) 7479000
7.80 4.24 0.45
88.58 92.61
MCDOWELL-N 889.55 (6.03) 15376250
(6.63) 1.39 0.55
98.25 97.20
NESTLEIND 19505.80 1.53
295025
17.79 6.67 0.40
96.29 97.02
TATACONSUM 730.90 (9.74) 10390950
17.38 4.74 0.43
97.37 96.28
TITAN 2442.45 1.50
4868625
12.66 2.75 0.42
97.46 91.48
UBL 1550.55 (1.51) 1090250
(8.57) 2.40 0.44
68.85 85.26
METALS & MINING
COALINDIA 146.40
(6.54)
46078200
(23.42) 1.78 0.64
92.80 88.49
HINDALCO 452.10
0.65
27775850
(2.86) 7.10 0.50
86.28 92.29
JINDALSTEL 371.70
(2.82)
34320000
0.65 5.64 0.84
98.37 97.67
JSWSTEEL 648.95
(5.01)
40203000
(9.98) 6.36 0.90
98.68 98.66
NATIONALUM 98.05
0.67
98702000
8.11 6.01 0.69
97.69 94.87
NMDC 131.75
(7.35)
82269300
(4.31) 3.47 0.70
94.97 82.88
SAIL 105.70
(4.26)
145620750
(1.50) 6.82 0.55
97.79 94.87
TATASTEEL 1102.95
(6.48)
46792075
(2.41) 2.31 0.91
97.77 97.20
VEDL 334.85
(8.71)
42597100
(11.21) 6.06 0.64
89.51 88.19
INFORMATION TECHNOLOGY
COFORGE 5874.45 8.91
605900 (10.75) 3.09 0.27 79.14 86.68
HCLTECH 1312.25 16.16
17545500
(27.66) -4.75 0.47 83.01
91.47
INFY 1902.15 10.02
29862300
(20.61) 6.40 0.85 88.77
94.23
LTI 7323.95 6.35
640200
20.29 5.61 0.44 80.24
89.52
MINDTREE 4758.40 0.41
2448600
34.41 6.82 0.32 96.72
96.37
MPHASIS 3361.10 2.84
1804950
52.32 6.02 0.15 94.89
96.08
NAUKRI 5489.65 (8.19)
1198625
35.80 5.29 0.76 96.50
91.19
TCS 3736.95 8.07
11903100
(7.91) 1.12 0.72 93.32
94.74
TECHM 1809.30 15.80
12012600
28.34 6.77 0.67 92.49
94.82
WIPRO 716.65 12.06
22024800
(23.56) 4.65 0.69 88.51
92.12
Derivatives Rollover Report
For Private Circulation Only
5
Scrip Price
Price
Change
(%) OI Futures
OI
Change
(%) COC (%) PCR-OI
Rollover
(%)
Average
Rollover
(3month)
(%)
INFORMATION TECHNOLOGY
HCLTECH 564.00
(0.70)
22885800
(1.26)
8.14
0.58
98.56
96.78
INFY 730.55
3.77
24351600
(52.50)
2.86
0.74
55.98
79.52
MINDTREE 782.95
10.93
1041600
(14.29)
-15.63
0.59
93.13
93.37
NIITTECH 1606.65
6.68
578250
26.08
-2.03
0.46
89.76
82.99
TCS 2212.80
6.19
15671500
(17.22)
6.42
1.91
95.02
94.74
TECHM 775.75
1.00
15406800
8.21
9.05
0.65
96.29
97.15
WIPRO 249.90
3.65
18211200
(29.64)
-2.08
0.72
83.12
92.60
MISCELLANIOUS
ABFRL 262.40
(5.63)
9448400
(15.21) 5.24 0.69 95.38 92.17
ADANIENT 1704.65
(3.60)
20793000
(6.91) 6.34 0.83 98.78 98.36
APOLLOHOSP 4985.55
(12.85)
2297125
23.05 3.89 0.29 95.59 94.44
ASTRAL 2279.65
3.33
526900
8.56 4.82 0.20 95.04 94.60
BATAINDIA 1823.25
(11.01)
1283150
(28.17) 4.45 0.72 94.22 90.62
BEL 209.50
(1.27)
20748000
(10.93) -2.79 0.50 95.91 90.63
CONCOR 607.55
(2.92)
6236800
2.47 6.47 0.94 92.00 94.74
CUMMINSIND 933.75
4.26
1093800
(19.59) 1.89 0.35 87.64 92.59
HDFCLIFE 643.70
(6.83)
19228000
25.29 5.70 0.85 93.65 95.72
ICICIGI 1376.55
(8.23)
3143300
13.84 2.56 0.74 98.10 93.56
INDHOTEL 177.25
(14.04)
14169506
(4.96) 2.95 0.68 93.42 93.73
INDIGO 1981.40
(4.64)
2630000
(27.54) 1.22 0.74 97.71 96.86
IRCTC 834.45
(3.68)
8233750
(19.14) 2.27 0.63 90.27 88.65
LALPATHLAB 3743.65
9.00
506750
5.22 4.61 0.29 96.41 93.17
LTTS 5602.00
4.42
576200
4.76 6.68 0.32 96.68 94.22
METROPOLIS 3441.35
17.08
534200
(14.50) 1.61 0.15 84.47 84.25
SBILIFE 1199.85
3.13
6819000
(6.13) 5.07 0.44 90.67 92.28
TRENT 1037.45
(5.39)
2080750
0.00 5.81 0.30 76.15 84.49
MEDIA
PVR 1271.05
(18.76)
2877083 (2.94) -2.35
1.40
94.18
94.81
SUNTV 489.90
(9.51)
11775000 (0.46) 5.48
0.60
97.83
91.13
ZEEL 319.05
(6.81)
75132000 (2.20) 3.89
0.64
97.55
95.95
OIL & GAS
BPCL 401.70
(7.26) 30477600 (17.82) 4.17
0.67
94.53
88.89
GAIL 141.00
(11.79) 44713000 (7.52) -4.05
0.67
78.05
88.16
GUJGASLTD 665.65
3.87
2130000 (67.60) 4.25
0.31
92.21
94.44
HINDPETRO 317.70
5.72
12719700 (35.63) 5.28
0.37
88.49
87.39
IGL 498.95
(6.80) 11237875 (5.82) 2.83
0.57
96.14
94.53
IOC 126.30
0.44
32480500 (14.21) 5.39
0.47
95.40
88.99
MGL 937.85
(13.86) 3853800 21.10 5.65
0.54
96.57
95.12
ONGC 156.00
7.70
37352700 (33.88) 6.05
0.47
89.11
80.07
PETRONET 223.45
(6.72) 18561000 (21.68) 5.16
0.69
94.43
87.65
RELIANCE 2498.20
(0.89) 34601750 23.95 2.18
0.67
95.98
94.36
AUROPHARMA 1037.15 6.60
8765250
(5.00) 7.85 0.51 97.81 95.86
BIOCON 383.45 (3.23) 17434000
0.03 5.93 0.71 86.18 89.52
CADILAHC 629.55 11.44
22301400
43.30 6.29 0.51 95.72 93.45
CIPLA 946.80 3.82
10505950
(19.23) 6.89 0.53 91.10 89.74
OIL & GAS
Derivatives Rollover Report
For Private Circulation Only
6
Scrip Price
Price
Change
(%) OI Futures
OI
Change
(%) COC (%) PCR-OI
Rollover
(%)
Average
Rollover
(3month)
(%)
PHARMACEUTICAL
APLLTD 804.05 1.52
1512700
(22.70) 7.17 0.24
89.64
95.44
AUROPHARMA 726.35 8.26
15246000
(4.18) 5.14 0.42
95.52
94.68
BIOCON 362.30 (0.67) 18055000
32.24 3.25 0.34
96.41
95.54
CADILAHC 481.20 3.66
17499900
(7.12) 4.76 0.58
95.76
96.03
CIPLA 956.70 5.86
9411350
(10.49) 5.40 0.61
91.18
94.77
DIVISLAB 4647.35 (3.44) 2450900
21.78 5.48 0.56
96.38
96.90
DRREDDY 4928.60 6.77
2184000
(16.65) 6.35 0.96
82.19
92.15
GLENMARK 527.40 (0.74) 9223000
(3.19) 6.33 0.43
97.37
97.29
GRANULES 339.90 7.36
13537700
(1.04) 6.36 0.20
95.33
96.18
LUPIN 939.45 4.04
6967450
(15.34) 2.22 0.57
92.39
94.50
PEL 2621.45 (1.59) 3199900
(7.63) 2.37 1.02
97.68
97.32
PFIZER 5037.45 2.59
143875
(19.74) 2.19 0.39
91.93
89.07
STAR 449.75 (11.47) 5593500
57.02 6.99 0.53
95.32
94.98
SUNPHARMA 836.05 6.41
27405000
(11.92) 2.50 0.50
89.29
94.93
TORNTPHARM 3204.80 6.91
705500
(9.06) 5.68 0.04
91.36
93.78
POWER
NTPC 125.70 (6.96) 58008900
15.53 -12.33 0.49
90.07
88.12
POWERGRID 206.35 2.76
29416828
65.00 6.35 0.60
93.48
79.20
TATAPOWER 219.35 (9.99) 95202000
4.98 5.97 0.83
95.27
94.13
REAL ESTATE
DLF 380.40 (7.03)
27093000
(15.98) 4.13
0.54 97.02
96.68
GODREJPROP 1849.35 (17.45)
3216525
70.37 6.30
0.43 95.77
94.06
TELECOM
BHARTIARTL 682.55 (11.13) 69424100 10.67 6.14
0.69
96.55
91.21
IDEA 14.15 19.92
502250000 (43.15) 13.97
0.39
71.46
86.11
INDUSTOWER 241.75 (18.66) 15164800 (0.17) 7.05
1.06
90.10
92.10
TEXTILES
PAGEIND 39571.90 (1.83) 72570 (8.13) 4.76
1.00
87.39
86.14

Derivatives Rollover Report
For Private Circulation Only
7
Technical and Derivatives Team:
Sameet Chavan
Chie
f Analyst
–
Technical & Derivatives
sameet.chavan@angelone.in
Sneha Seth Derivatives Analyst sneha.seth@angelone.in
Rajesh Bhosale Technical Analyst rajesh.bhosle@angelone.in
Osho Krishan Senior Analyst – Technical & Derivatives osho.krishan@angelbroking.in
Research Team Tel: 022 – 39357600 (Extn. 6844) Website: www.angelone.in
For Technical Queries E-mail: technicalresearch-cso@angelbroking.com
For Derivatives Queries E-mail: derivatives.desk@angelbroking.com
DISCLAIMER
Angel Broking Limited (hereinafter referred to as “Angel”) is a registered Member of National Stock Exchange of India Limited,
Bombay Stock Exchange Limited and Metropolitan Stock Exchange Limited. It is also registered as a Depository Participant with
CDSL and Portfolio Manager and investment advisor with SEBI. It also has registration with AMFI as a Mutual Fund Distributor.
Angel Broking Limited is a registered entity with SEBI for Research Analyst in terms of SEBI (Research Analyst) Regulations,
2014 vide registration number INH000000164. Angel or its associates has not been debarred/ suspended by SEBI or any other
regulatory authority for accessing /dealing in securities Market.
This document is solely for the personal information of the recipient, and must not be singularly used as the basis of any
investment decision. Nothing in this document should be construed as investment or financial advice. Each recipient of this
document should make such investigations as they deem necessary to arrive at an independent evaluation of an investment in
the securities of the companies referred to in this document (including the merits and risks involved), and should consult their
own advisors to determine the merits and risks of such an investment.
Angel or its associates or research analyst or his relative may have actual/beneficial ownership of 1% or more in the securities of
the subject company at the end of the month immediately preceding the date of publication of the research report. Neither Angel
or its associates nor Research Analysts or his relative has any material conflict of interest at the time of publication of research
report.
Angel or its associates might have received any compensation from the companies mentioned in the report during the period
preceding twelve months from the date of this report for services in respect of managing or co-managing public offerings,
corporate finance, investment banking or merchant banking, brokerage services or other advisory service in a merger or specific
transaction in the normal course of business. Angel or its associates did not receive any compensation or other benefits from the
companies mentioned in the report or third party in connection with the research report. Neither Angel nor its research analyst
entity has been engaged in market making activity for the subject company.
Reports based on technical and derivative analysis center on studying charts of a stock's price movement, outstanding positions
and trading volume, as opposed to focusing on a company's fundamentals and, as such, may not match with a report on a
company's fundamentals. Investors are advised to refer the Fundamental and Technical Research Reports available on our
website to evaluate the contrary view, if any.
The information in this document has been printed on the basis of publicly available information, internal data and other reliable
sources believed to be true, but we do not represent that it is accurate or complete and it should not be relied on as such, as this
document is for general guidance only. Angel Broking Limited or any of its affiliates/ group companies shall not be in any way
responsible for any loss or damage that may arise to any person from any inadvertent error in the information contained in this
report. Angel Broking Limited has not independently verified all the information contained within this document. Accordingly, we
cannot testify, nor make any representation or warranty, express or implied, to the accuracy, contents or data contained within
this document. While Angel Broking Limited endeavors to update on a reasonable basis the information discussed in this
material, there may be regulatory, compliance, or other reasons that prevent us from doing so.
This document is being supplied to you solely for your information, and its contents, information or data may not be reproduced,
redistributed or passed on, directly or indirectly.
Neither Angel Broking Limited, nor its directors, employees or affiliates shall be liable for any loss or damage that may arise
from or in connection with the use of this information. Angel or its associates or Research Analyst or his relative might have
financial interest in the subject company. Research analyst has not served as an officer, director or employee of the subject
company.
